Tata Steel Ltd. - WEEKLY CHART VIEW!!Tata Steel Ltd. trading near resistance level whereas technical indicators are bullish if price closes above resistance level 442 near by resistance is 500 and support is 438 on weekly chart.
Search in ideas for "TATA STEEL"


Tata Steel - Price should break 440 for upmoveTata Steel has been enjoying a great run lately due to positive global news for the sector
The stock has rallied from a low of 250 to CMP 423, a 169% growth
The stock is trending on Daily charts.
However the stock will have to break 440 on weekly charts with momentum and high volumes to enter a new zone
The stock is trading above all the major averages including 10, 50, 100 and 200
There has been a gradual shift of Control Price on Volume Profile from 275 to 340 to 400 which is a Bullish sign
The stock has potential to reach 475 levels in short term provided Global environment stays positive.

Tata Steel Broken Bullish channel Short @ 531-540 levels CMP 5Tata Steel Broken Bullish channel
Short @ 531-540 levels CMP 523.35
Targets - 520- 500-490-470+
All cash Levels

Tata steel Intraday setupTata steel has shown a good signal broke the resistance and retraced on the support now its time to long
only and only buy above 377***
With a Stop loss of 370***

Tata Steel - Cup & Handle breakoutTata Steel Daily chart - clear Cup & Handle pattern with neckline breakout with above-average volumes

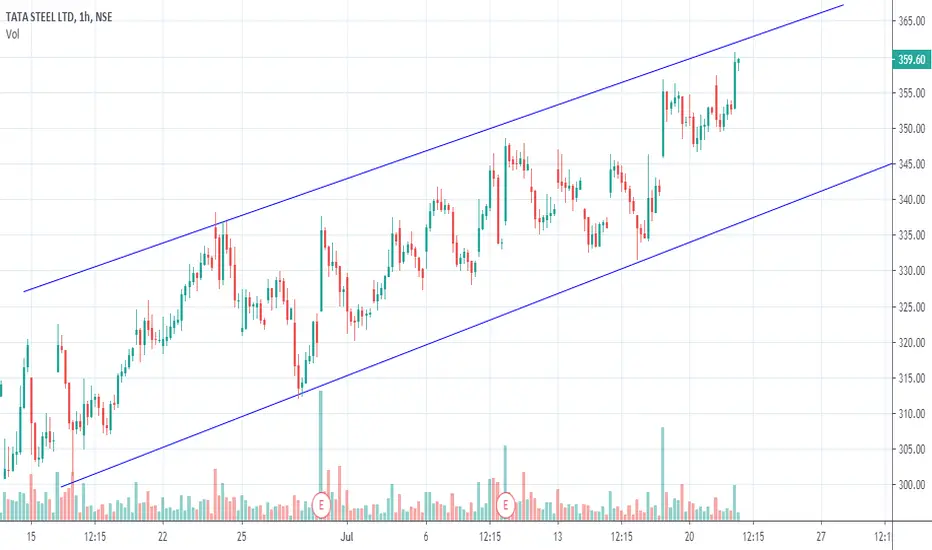
TATA STEEL BREAK-OUT WITH HIGH VOLUME :-)TATA STEEL breaks-out the channel with high volume. The break-out will be confirmed above 379 level.
check-out the over all market conditions before taking any decision.
If this analysis beneficial to you let me know by likes and comments. follow for regular updates.
Disclaimer: This analysis only for information purpose, do your own analysis before taking any decision.
Trade or invest at your own risk.

TATA STEEL LONG !TATA STEEL looks good on chart ! can be accumulate for positional long for target 400/- with stop loss 330/-

TATA STEEL LOOKS GOOD TO BUY ABOVE 364TATA STEEL LOOKS GOOD TO BUY FOR LONG POSITION ONCE CROSSES 364. STAY LONG
REGARDS,
BULLISH TRADERS

TATA Steel TATA Steel Trading in Parallel Channel
Go long if breaks the pattern or short if resist.
Take this view only for educational purpose. Trade on your own risk.
Tata Steel LongTata Steel cup n handle formation above 350 sustaining can show 358/370/387 with support of today's low 331...also above 358 to 375 is gap so careful on this zone....


TATA STEEL LTD. SELL BELOW 320 TGT 308TATA STEEL LTD.
The stock made a bearish move today and closed above an important DEMAND zone (325 - 320).
RSI is below 40 and bearish>
TT2 is Bearish.
If the prices break this DEMAND ZONE with volume, the prices will fall swiftly towards 308 levels.
KEEP AN EYE!!
***this is my personal view. Please take advice from your financial advisor before investing.

TATA STEEL - Sell Below 320 TGT 308TATA STEEL LTD.
The stock made a bearish move today and closed above an important DEMAND zone (325 - 320).
RSI is below 40 and bearish>
TT2 is Bearish.
If the prices break this DEMAND ZONE with volume, the prices will fall swiftly towards 308 levels.
KEEP AN EYE!!
***this is my personal view. Please take advice from your financial advisor before investing.


Tata Steel IdeaTata Steel Idea -
Buy above 311 with 10 point SL if it breaks upwards
Sell below 250 with 10 point SL if it breaks downside.
Risky traders, If it reverses from 251, can take a trade with 5 point SL for target of 270, 290, 310

TATA STEEL SHORT till 260TATA STEEL forming XABCD bearish pattern , it might hit 260 and good shorting candidate
Note:This analysis only for Education purpose only.

Tata Steel Ltd. - When will it breakout of the Triangle Pattern?Tata Steel Ltd.
The stock is consolidating in a symmetrical triangle pattern in the daily chart.
Technical indicators are neutral. Time-Trend indicator is Bearish.
If the prices give the downward breakout fromt he triangle, the prices might swiftly move to 254 in couple of days.
However, it is likely to see breakout above swing high of 290 levels and the price can touch 305 price point.
KEEP AN EYE!!


TATA STEEL LONGTata steel standing on strong support on weekly timeframe chart. IT IS GOOD BET FOR THE SWING TRADING IN JUNE OR JULY FOR THE UPSIDE OF 50%. IT WILL TRADE IN 270 TO 310 RANGE FOR MORE 2-3 WEEKS.

Tata Steel Ltd. - BEARISHTata Steel Ltd. - BEARISH IN WEEKLY AND MONTHLY TREND
Trading near the support level.
Technical indicators are bearish.
Nearby support is 250. If price closes below 250 level next support is 200 and the resistance is 304 on the weekly chart.
